
The Brain in Sports
In most sports, decision-making is required in the form of action-reaction. A basketball player dribbles right and the defender has to react and mirror the movement. A pitcher delivers to the plate and the baserunner has to react appropriately if they are going to steal second base.
An often-unquantifiable question in player evaluation in baseball is the difference between true speed and game speed. The fastest runners aren’t always the best baserunners. And from the table below, the players with the highest sprint speeds in MLB in 2020 were scattered from 4th to 164th on the stolen base leaderboard for the season. Additionally, the players with the highest stolen base totals in 2020 were scattered from 2nd to 198th on the max sprint speed leaderboard.
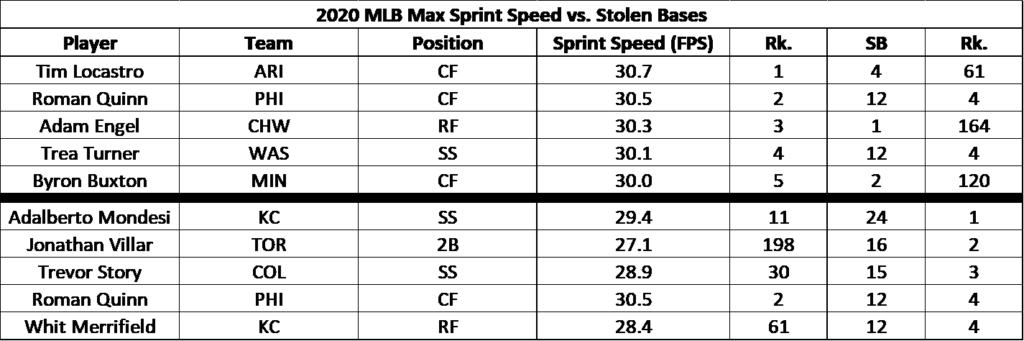
Why are Jonathan Villar, Trevor Story, and Whit Merrifield so effective at stealing bases and Adam Engel and Byron Buxton, 2 of the top 5 fastest players in the game in 2020, combined for only 3 in 75 games?
While we don’t have all the answers, we set up an observation with a group of high school baseball players to see if the level of difficulty in decision-making had an effect on 10-yard run times, average foot speed for the first five steps of their sprints, and/or reaction time. Consider this “dipping our toe into” the topic.
Method
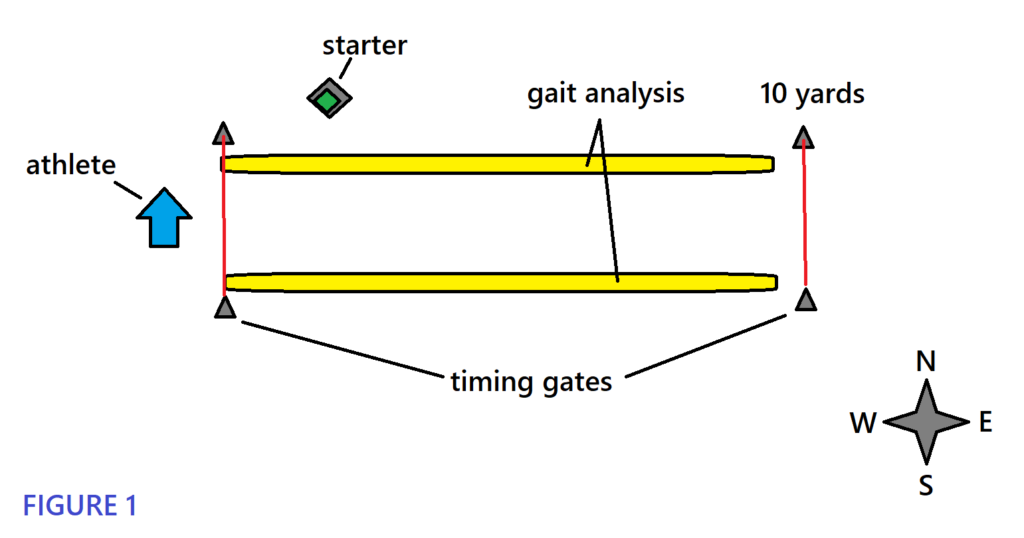
For this observation, we were able to measure an electronically timed 10-yard split and foot speed (measured in feet per second) for the first five steps of the sprint (using OptoJump for gait analysis) for 8 high school baseball athletes. Shout out to our friends at Huntington Beach High School for providing us with their time and legs. We set up on a track and all athletes started in a baserunning position regardless of the start-type (from a bird’s eye view, athletes started oriented northward and ran east – see Figure 1).
Each athlete ran a total of nine, 10-yard sprints: 3 self-start (SS), 3 single-decision start (SD), and 3 double-decision start (DD) – defined below:
Self-start (SS) – each athlete starts on their own when they are ready.
Single-decision (SD) – each athlete starts when the starter (see orientation in Figure 1) counts down from 3 and randomly turns green. The athlete is reacting to the green box and running.

Double-decision (DD) – each athlete starts when the starter counts down from 3 and randomly shows a green arrow pointing right. If the green arrow points left, the athlete does not run. The athlete is either 1) reacting to the green arrow pointing right and running or 2) reacting to the green arrow left and not running – hence, double-decision.
Reaction Time – the reaction time is measured from when the starter turns green (SD) or “arrow right” (DD) to when the athlete breaks the timing gate beam to the right of their right foot on their cross-over step (with their left leg as they start sprinting).
Each athlete rested while the other 7 athletes took their turns running to ensure that fatigue had as little of an influence on the run times as possible (there wasn’t a trend of slower times as they ran more across the eight athletes).
Each athlete ran their nine trials in the following order: SS, SD, DD, DD, SS, SD, SD, DD, SS.
Predicted Outcome
Prior to organizing this observation, the Loden Sports team predicted that increasing the level of decision on the start would negatively affect the 10-yard time and sprint speed in the first five steps. This hypothesis stemmed from the thought that as decision-making difficulty increased, more attention would initially be made to the decision as opposed to the sprint.
Results
Section I: 10-yard Times: Self-Start vs. Decision (SD or DD)
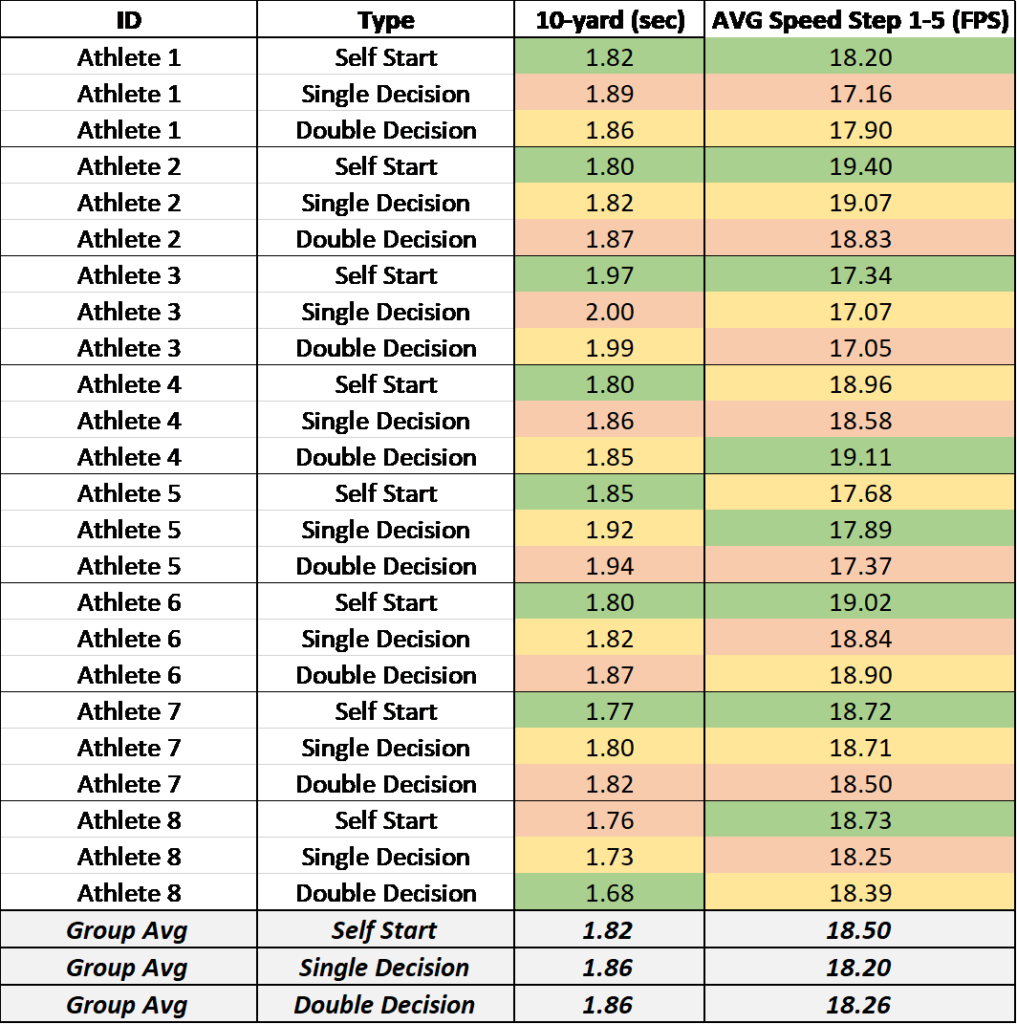
For 7 out of 8 athletes, their fastest average 10-yard time occurred on the self-started sprints. Conversely, 7 out of 8 athletes had their slowest average 10-yard time when a reaction-decision was involved to start the sprints.
We took the average speed in feet per second for the first five steps of the sprint and in doing so found that 6 out of 8 athletes had their fastest average speed in feet per second for their first five steps on the self-started sprints. All 8 athletes had their slowest average speed in feet per second for their first five steps on sprints that involved a reaction-decision to start.
Section II: 10-yard Times: Single-Decision vs. Double-Decision
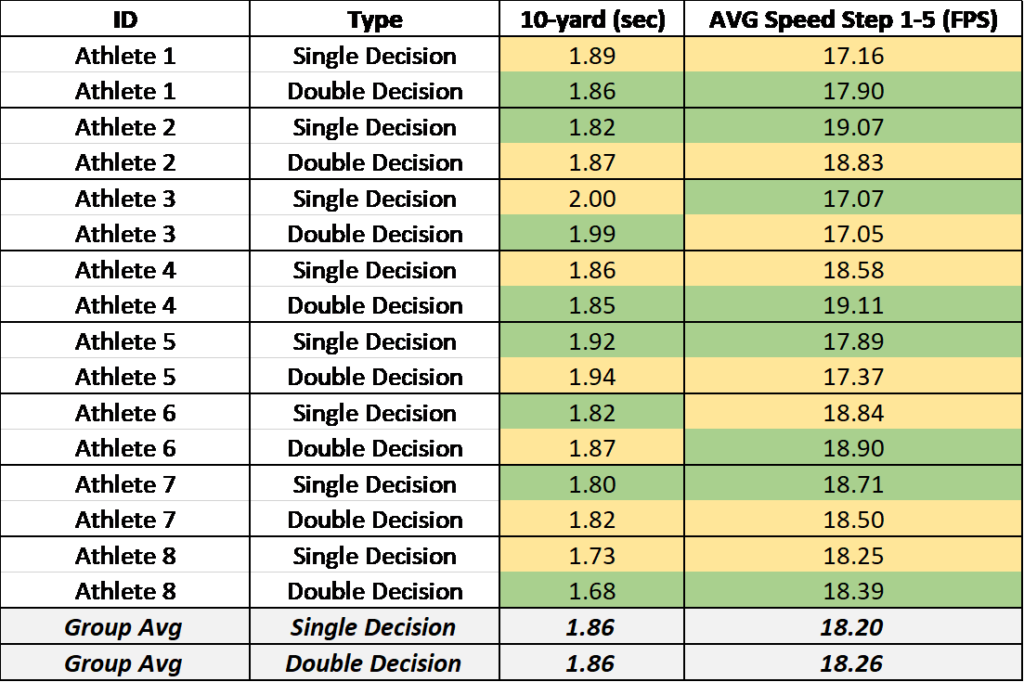
5 out of 8 athletes had a faster average 10-yard time when they started off of a single-decision as opposed to a double-decision.
It was an even split between fastest average speed in feet per second for the first five steps: half of the athletes were slightly faster on the single-decision start and half of the athletes were slightly faster on the double-decision start.
Section III: Reaction SD vs. DD
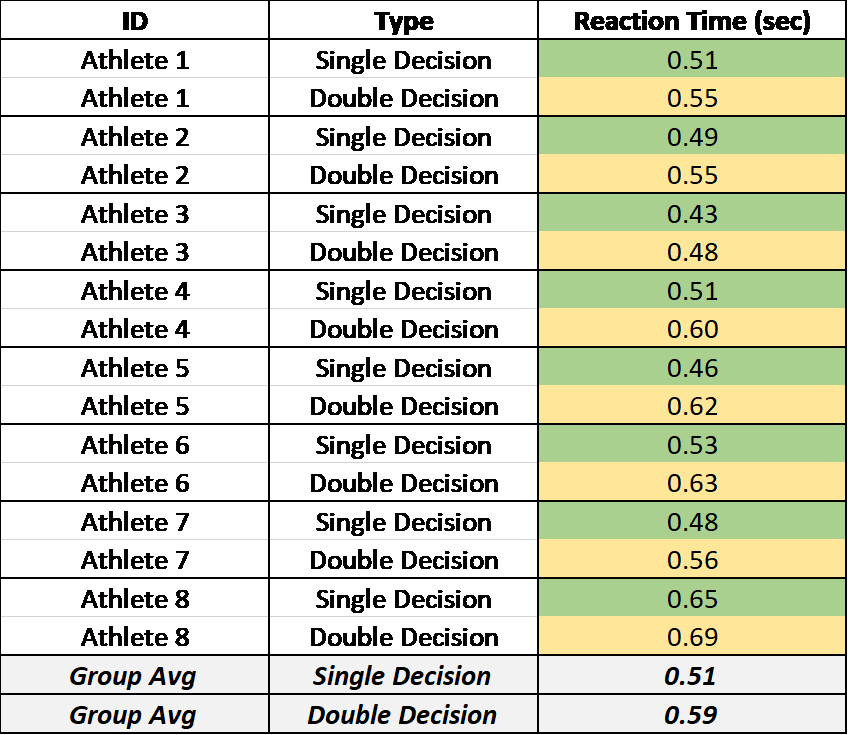
All 8 athletes had a faster average reaction time to the single-decision start vs. the double-decision start. Collectively, the average single-decision start was .51 seconds. The average double-decision start for the group was .59 seconds – 13.6% slower.
Section IV: Combined Effects
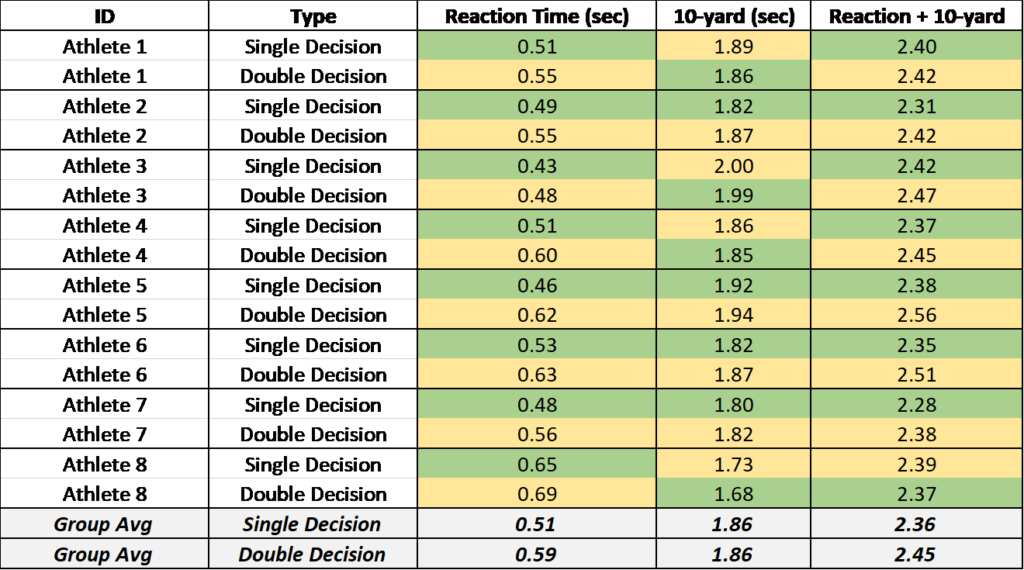
Piecing it all together, let’s consider that this group of 8 athletes, on average, were .04 seconds faster on their run times with a self-start vs. a reaction-decision start. While there was no gap in pure run times between the single-decision and double-decision start, the group was collectively .08 seconds faster reacting to a single-decision start vs. a double-decision start. Knowing that, let’s look at average reaction times + 10-yard run times for each athlete.
We discussed in Results, Section II and you can see it again in the table above that the group averages for single-decision and double-decision 10-yard run times were identical (1.86), BUT, for no individual cases was this true (okay, Athletes 3, 4, 5, and 7 – pretty close). Athlete 2, for instance, lost .05 seconds on his 10-yard run time from single-decision to double-decision and Athlete 8 gained .05 seconds.
So, considering the trend of a slower reaction when the start-type was double-decision vs. single-decision (addressed earlier in this section), let’s look how the individual run time effects make an athlete slower or allow them to gain ground:
- 7 out of 8 athletes had a faster average Reaction + 10-yard time when the start-type was single-decision vs. double-decision.
- Athlete 1 and Athlete 8 had average Reaction + 10-yard times within .02 seconds of their respective single-decision and double-decision averages.
- 4 out of 8 athletes were at least .10 seconds slower on average for their Reaction + 10-yard times when starting with a double-decision vs. a single-decision.
- Athlete 6 was .16 seconds slower and Athlete 5 was .18 seconds slower on average for their Reaction + 10-yard times when starting with a double-decision vs. a single-decision.
All of this to say that it is apparent that reaction decisions affect athletes differently.
Conclusion
When a double- or single-decision is required, athletes 10-yard times are slower vs. self-started sprints. From what we observed, we could hypothesize that when the brain has to focus on an external stimulus (to react to), it delays the athletes focus on running long enough to impact their run times.
The double-decision start collectively slowed the athlete’s average reaction times by nearly 14% compared to the single-decision start. Considering that stealing a base is a double-decision scenario (steal or retreat on a pick-off attempt), a double-decision reaction may be a more effective way to train baserunning as opposed to a single-decision reaction (more similar to the game environment).
As Results, Section IV outlines, reaction decisions effect every athlete differently in terms of pure run times and in terms of how quickly the brain reacts and gets the body moving. While we still don’t have the answers, what we observed supports a potential answer to the question posed in the beginning of this blog:
Why are Jonathan Villar, Trevor Story, and Whit Merrifield so effective at stealing bases and Adam Engel and Byron Buxton, 2 of the top 5 fastest players in the game in 2020, combined for only 3 in 75 games?
Going Further
Are some guys inherently better at reacting to the double-decision?
Are some guys less affected in their 10-yard sprint times and foot speed in their first five steps by the level of decision-making?
Additionally, it would be interesting to look to see if the trends we observed are consistent across a larger sample size. The results of this observation merely crack the door into exploring and understanding why the fastest pure-runners aren’t always the best baserunners and this certainly has applications for other sports.
Could further research have implications on talent identification and tactical decision-making? There’s a lot more work to be done here.