
Long has it been said that speed kills. But what does speed mean in the context of Major League Baseball? There are different components to speed (ex. top speed, acceleration, change of direction). For this project, we explore specifically top speed (peak running speed).
This project explores what peak running speed is good for in Major League Baseball.
A Statcast metric that has become popular in recent years on Baseball Savant is Sprint Speed (ft / sec). While using this metric can help us answer questions about peak running speed in Major League Baseball, it does leave a substantial gap when considering amateur evaluation – which is something we care about.
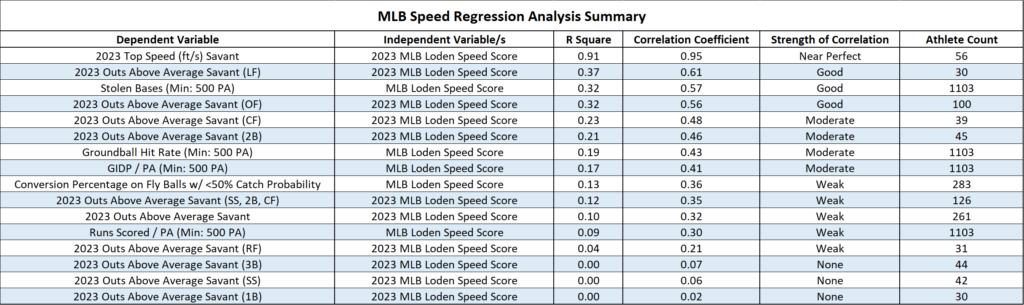
When looking at peak running speed, is the Loden Speed Score a viable substitute for Sprint Speed (ft / sec)? With a correlation coefficient of .95, there is a near perfect correlation between Loden Speed Score (calculated using data publicly available on Baseball Savant) and Sprint Speed (ft / sec). To answer the question, yes, they are practically interchangeable. Using the Loden Speed Score, we can now compare – apples to apples – a meaningful peak running speed metric that can easily be attained in a workout to every big leaguer dating back to the 2015 season.
What is peak running speed good for in Major League Baseball?
Why specifically is peak running speed valued in Major League Baseball? Using Baseball Savant, we were able to pull data from 2015 through 2023 to analyze the value of peak running speed in Major League Baseball.
Offensive Observations
Using a sample of 1,103 Major League Baseball players that registered a minimum of 500 plate appearances in a season between 2015 and 2023, there was a good correlation (.57 correlation coefficient) between the Loden Speed Score and stolen bases. Big leaguers with greater peak running speed are more likely to steal bases successfully.
Using the same sample as above, there was a moderate correlation (.43 correlation coefficient) between the Loden Speed Score and what percentage of groundballs hit turned into base hits. Think of this as peak running speed effecting the odds of beating out a groundball for an infield hit.
There was a moderate correlation (.41 correlation coefficient) between the Loden Speed Score and what percentage of plate appearances resulted in a ground ball hit into a double play (minimum: 500 PA). Big leaguers with a higher Loden Speed Score have a lower rate of grounding into double plays.
To summarize, the Loden Speed Score (peak running speed) is useful in predicting stolen bases, what percentage of groundballs will turn into base hits, which players will ground into fewer double plays, and runs scored per plate appearance.
Defensive Observations
We ran an analysis to look at the relationship between the Loden Speed Score and Outs Above Average (OAA) by position for the 2023 MLB season for qualified players. OAA is defined as a range-based metric of skill that shows how many outs a player has saved over his peers at his position (Baseball Savant).
- There was a correlation between Loden Speed Score and OAA for left fielders (.61; good), center fielders (.48; moderate), and second basemen (.46; moderate).
- For outfielders as a whole, there was a good correlation between Loden Speed Score and OAA (.56; good).
- For right fielders, there was a weak correlation between Loden Speed Score and OAA (.21; weak).
- For third basemen, first basemen, and shortstops, there was no relationship between Loden Speed Score and OAA.
Overall, outfield positions are most dependent on peak running speed to optimize defensive value.
Loden Speed Score Profiling by Position
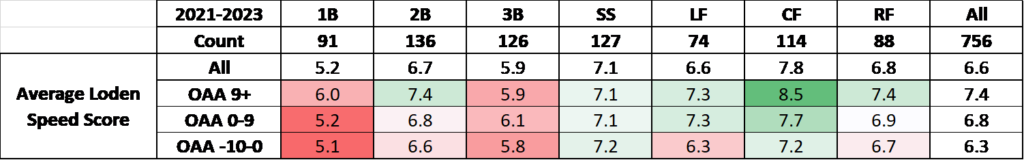
In addition to running regression analysis on defensive metrics, we compiled MLB position averages for the Loden Speed Score from the years 2021-2023. The chart above shows that the average Loden Speed Score for MLB position players is 6.6 (not including catchers or DH’s). The position with the highest average Loden Speed Score is centerfield (7.8) and the position with the lowest Loden Speed Score is first base (5.2). Shortstop and centerfield were the only two positions with an average Loden Speed Score greater than 7 – 7.1 and 7.8 respectively.
Looking below the position averages, there are three rows for Loden Speed Score averages clustered by OAA and position.
- The average Loden Speed Score for players who attained 9+ OAA at their position is substantially higher for 1B, 2B, LF, CF, and RF compared to the average Loden Speed Score at their position.
- At the shortstop position, the average Loden Speed Score of 7.1 is consistent regardless of OAA achieved in a single season between 2021-2023.
- At the CF, RF, and 2B positions, the average Loden Speed Score is much higher for players who attained 9+ OAA in a season between 2021-2023 vs. players at those positions who did not.
The average Loden Speed Score of 8.5 for centerfielders with a season of 9+ OAA stands out. As it turns out, in the past three seasons, only 1 out of 26 center fielders who registered 9+ OAA in a season had a Loden Speed Score under 8 (Kyle Isbel; 7, 2023).
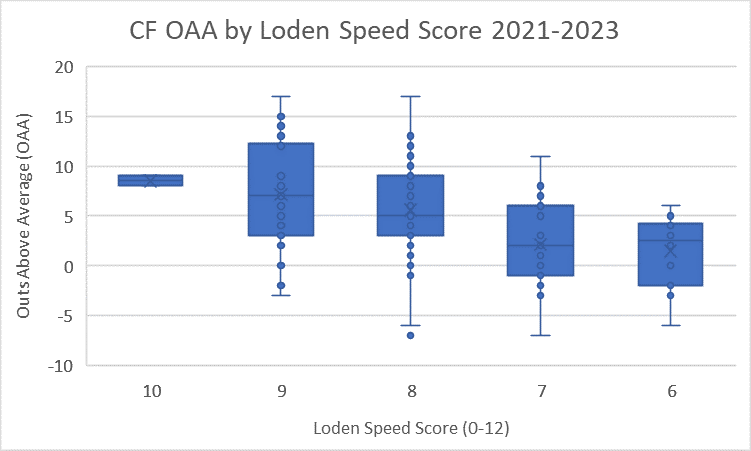
To have an elite defensive season by the advanced metric OAA in center field (9+ OAA), you better be able to run fast. For centerfielders, the median OAA increases as Loden Speed Score increases from 7 to 10.
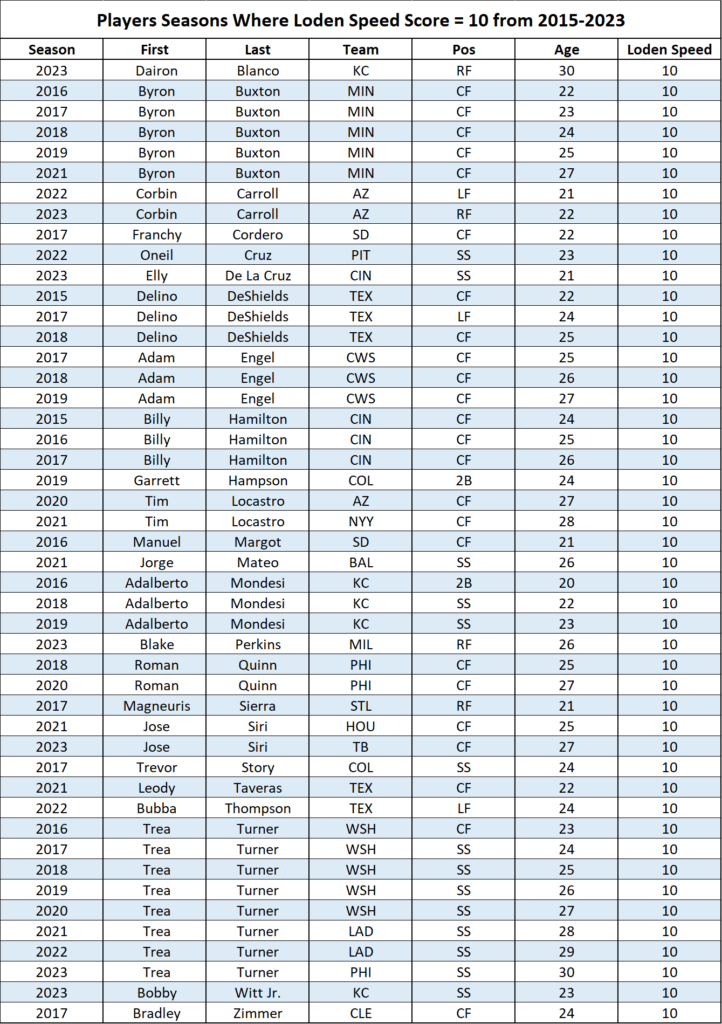
The One-Percenters
Since 2015, there have been 4,668 player seasons that could be used to register a Loden Speed Score. Out of those 4,668, just 47 (1%) registered a Loden Speed Score of 10. Out of the 47, there are 24 unique players. Here they are listed alphabetically by last name: