
Overview
In 2022, Loden Sports evaluated 203 unique athletes affiliated with the Cardinal Gibbons High School football program in Raleigh, North Carolina across the freshman, JV, and varsity teams. At the beginning of June and the end of July, every healthy athlete in the program went through a full evaluation inclusive of a weigh-in, a 20-yard sprint test (speed), a 3 Rebound Jumps test (power and quickness), and a single leg jumps test (lower-half symmetry).
Starting at the beginning of August and concluding on the day before the last game of the season, each member of the varsity program completed a weekly 3 Rebound Jumps test to track and monitor physical readiness using the average power output and average reactive strength index (RSI) of the jumps each week. What are these two metrics and what do they mean?
Average Power Output measured in Loden Power Points
For our purposes, the relationship between body weight and how high an athlete can jump. Over-simplified: can the athlete explosively move weight with their lower-half. This is a bit of a gold-standard metric for athleticism in all sports. Higher power outputs can be achieved by jumping exceptionally high at a lighter body weight; high at a moderate body weight; or moderately high at a larger body weight.
Average Reactive Strength Index (RSI)
the relationship between the flight time of a jump and the time spent on the ground. Higher numbers are better. An observed decline in RSI over a period of time can be an indicator of fatigue or a signal for injury. A decline in RSI can often times be simplified as “more time spent on the ground to jump the same height” – hence, why it is important to track for monitoring fatigue over the course of a season.
A football season has long been termed “a war of attrition.” Through the practice of monitoring physical readiness every week with objective jump testing, Loden Sports provided the Cardinal Gibbons Varsity football program a unique insight into this well-known trope.
Wear and Tear
What can a single 3 Rebound Jumps test each week tell us?
Weekly Readiness Scoring
We developed a simple readiness scoring system that focuses on the power output and RSI of the weekly 3 Rebound Jumps test for each athlete.

- Each athlete was scored on the above scale for power and RSI.
- Their two scores were added together to get their readiness score.
- We’re looking for Green Circles.
- Yellow Triangles are worth keeping an eye on.
- Red Diamonds may warrant a discreet conversation with the athlete about how they’re feeling, routines, etc.
Each week, we monitored changes on a week-to-week basis and on a preseason-to-current week basis. We presented all of the week-to-week changes, while making specific callouts on the preseason-to-current week changes if notable.
What We Observed
- Player1: This was the big one we caught with the weekly readiness score. On September 8, Player1 came up red on both power and RSI – conversation with Player1 revealed a knee issue.
- Player2: No sport beats up their best amateur players like basketball. Player2 saw his power output drop 7% and his RSI drop 5% between June 6 and July 25. From July 25 to September 22, both rebounded, 7% and 4% respectively and then held consistently or improved slightly for the duration of the season. Over-simplified: the football season was a reprieve for his body. Depending on his projected role in 2023, Player2 may want to consider a lighter summer basketball schedule.
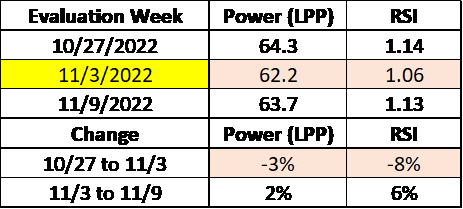
- Flu Recovery: On November 3, 6 players who completed their weekly readiness jumps reported that they were recovering from the flu. We took the average power and RSI of all 6 players from the week before; the week they reported they were recovering; and the week after, to see what the impact of the flu was on their physical readiness. The 6 players saw a power drop of 3% and an RSI drop of 8% in the week they reported that they were recovering. The following week, the group collectively rebounded 2% in power and 6% in RSI. We can use this instance as a small peak at the impact of seasonal illness on performance.
Is the "war of attrition" an equal fight?
From what we observed, the answer is no. For this analysis, we looked at both power output and RSI changes from July 25, 2022 to November 9, 2022 for all athletes evaluated on both of those dates. What we found (sorted by Avg RSI Change):
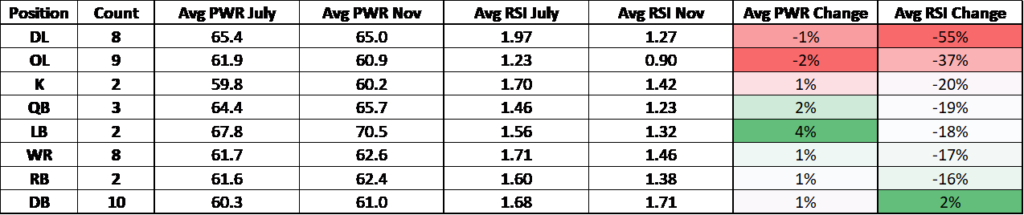
- The bigs were hit the hardest. The DL and OL groups both lost more than -37% of their RSI from July to November.
- The three groups that took the least hit to their RSI were all little skill groups (WR, RB, DB).
- The only group to not have a negative RSI change from July to November (DBs) was also the deepest (in terms of bodies) group represented.
- The average change in RSI for the entire team was -20%.
- Conclusion: wear and tear is going to hit everyone, but it’s going to hit the bigs a little harder.
An additional note: over the course of the season, there were 24 instances of a red flag on the readiness report for the preseason-to-current week look. 21 (88%) of those instances were either an OL, DL, or TE. These weekly observations support what is displayed above.
Were varsity findings consistent with JV?
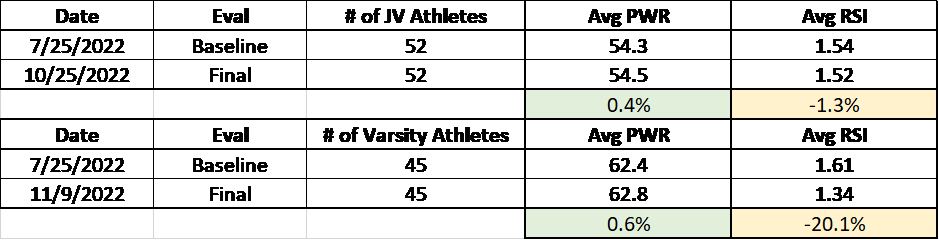
While the varsity played 2 more regular season games and 1 more scrimmage than the JV team, we observed a similar non-change (slight increase) in average jump power from baseline to final evaluation. The stark contrast was in RSI change. Whereas the average JV player lost -1.3% of their RSI from pre- to post-season, the average varsity player lost -20.1% of their RSI from pre- to post-season. From this, we are putting an objective number on a pretty obvious observation: varsity competition takes a greater toll on the body than JV competition.
Which positions were most athletic?
Shifting gears from looking at monitoring over the course of the season… Loden Sports evaluated all athletes in the Cardinal Gibbons Football program in early June and then again in late July. From the more thorough evaluation that also included a sprint test, we were able to objectively score every athlete using the Loden Score System. Each athlete received a Power, Quickness, Speed, and overall raw athleticism (Loden Score). All scores are on a 0-12 scale. The below chart shows varsity position averages aggregated following the full evaluations this summer:
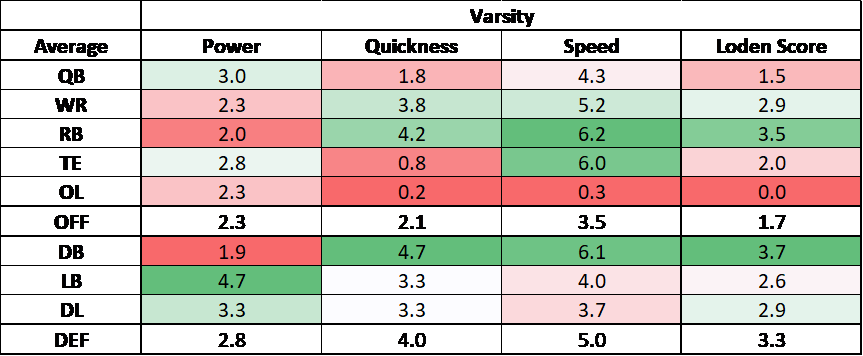
- The most athletic group per average Loden Score was the DB group (3.7), followed closely by RBs (3.5), and then DL (2.9) and WRs (2.9).
- The least athletic group was the OL (0.0).
- The average Loden Score on the defense (3.3) was nearly double that of the average Loden Score on the offense (1.7).
While profiling average athleticism by position is interesting, it doesn’t tell the whole story. While it may give you an idea of the expected performance of a group as a whole, it doesn’t provide the more individualistic look. As we’ll see in the next section, there were good athletes in each position group on both sides of the ball that separated themselves in their on-field performance.
Power Output as an Indicator for Performance: Post-Season Recognition
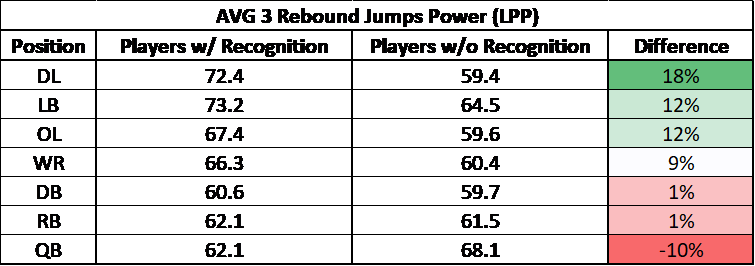
Average power measured in Loden Power Points (LPP) over the course of the season was an indicator of post-season recognition for a number of positions. Post-season recognition for the sake of this observation is defined as being named CAP-6 All-Conference, CAP-6 All-Conference Honorable Mention, or CAP-6 Conference Player of the Year.
- The differences were most obvious in the populations of larger-bodied athletes. Power generation, a key indicator of athleticism, in the DL, LB, and OL groups were a separator between players with and without post-season recognition.
- WRs with recognition produced, on average, 9% more power over the course of their weekly jump monitoring vs. WRs without post-season recognition.
- In one of the larger groups, there wasn’t a significant difference in power output between DBs with and without post-season recognition.
- Due to sample size (RB and QB group) and the skill-specialization of the QB position, it’s hard to say whether what was observed in those groups in regards to power output yields any signal.
- The loudest conclusion drawn from this set of observations is the importance of power output and athleticism in the DL, LB, and OL groups.
Power Output as an Indicator for Performance: Counting Stats
We ran regression analysis on averages in the jump data over the course of the season vs. a handful of counting stats and found a few interesting relationships.
- We found that for the 8 receivers who had at least 5 catches on the year, average power on their 3 Rebound Jumps test was highly correlated to yards per catch.
- We found that for the 15 defensive players who played in at least 6 games, average power was moderately correlated to both tackles per game and tackles for loss per game.
- We found that for the 9 offensive players who rushed the ball at least 10 times, there was a weak relationship between average power and yards per carry.
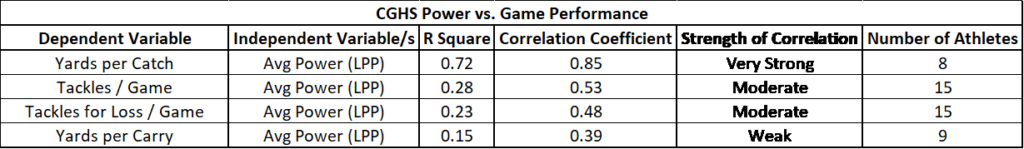
We do believe there is potentially a stronger relationship between average power and yards per carry that would require a larger sample size and more descriptive data. It’s hard to draw any conclusions with confidence when quarterback data gets a little muddy on what’s a sack and what’s an actual rush attempt. Overall, we do believe that the observed relationships between average jump power and yards per catch, tackles per game, and tackles for loss per game are really interesting and could be worth investigating further with a larger sample size.
Thank you.
Thank you to the Cardinal Gibbons High School coaching staff for providing an open-mind and weekly dialogue and observations from their point of view. And also, of course, a special thank you to the players for buying-in and competing with each other, and themselves, on a week-to-week basis while collectively accumulating over 1,000, 3 Rebound Jump tests.