

Overview
Over the course of the MiLB (Minor League Baseball) season, a player completed a weekly performance evaluation to monitor physical readiness and the impacts of a minor league season. Most often, this player played LF (56 games), followed next by 17 games each at 1B and 3B.
With the exception of a dislocated rib that sidelined him for a week and a half in June, this player remained healthy and in the lineup for the entire duration of the season. Further background to consider on this player: he lived at home (being a native of the area where his MiLB team is situated), commuted 40 minutes each way to and from the ballpark, regularly got 8 hours of good sleep, maintained a soft tissue recovery routine, and lifted 1-2 times per week.
In-season lifts generally consisted of trap bar deadlifts, squats, kettle bell squats, Bulgarian split squats, push-ups, lat pulldowns, hamstring curls, dumbbell bench press, core work, dumbbell rows, and arm band shoulder work.
The player was surveyed at each evaluation on how many total innings he played, subjective observation of how he was feeling, and how well he slept over the course of the week.
Prior to spring training in Arizona, the player weighed in at 209.2 lbs. on March 22, 2021. On May 10, 2022, after the first full week of the season, the player weighed in at 199.2 lbs. From that point forward, he stayed between 199-204 lbs. for the entire season.
The Evaluation
Workload
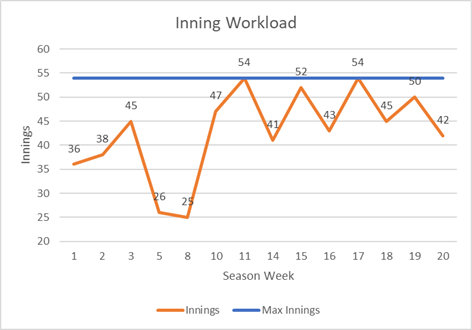
The player’s weekly workload (innings) was monitored in conjunction with the performance metrics. A standard Low-A MiLB week had 54 regulation innings to allocate. The chart below displays the ebb-and-flow of the player’s inning workload over the course of the season.
CMJ (3 Jumps)
The counter movement jump assessment was used to monitor changes in lower-half power output and quickness. The three primary metrics that were tracked were average height in inches for the three jumps (Height), average power for the three jumps (Loden Power Points – Loden Sports measure for power), and average RSI for the three jumps (RSI – flight time divided by contact time).
The charts below display four lines each. Grey data points are the player’s outputs on that given day. The blue line is the average for the metric over the course of the season. The green line is one standard deviation above average for the metric over the course of the season and the red line is one standard deviation below. The exercise for the player over the course of the season was to keep his data points on the road bordered by the red and green lines. If a combination of metrics got way out of whack in the wrong direction, it could have required an intervention to get things going in the right direction again. Fortunately, this wasn’t the case.
Metrics from the CMJ 3 assessment have been found to correlate to exit velocity, throwing velocity, and top-end running speed, so changes in the performance outputs from this assessment week-over-week likely shows up on the field. Again, the importance of keeping the weekly data points on the road. For the data points that are greater than one standard deviation in the positive direction, the athlete may have a little extra energy, power, speed, etc.
CMJ Average Height
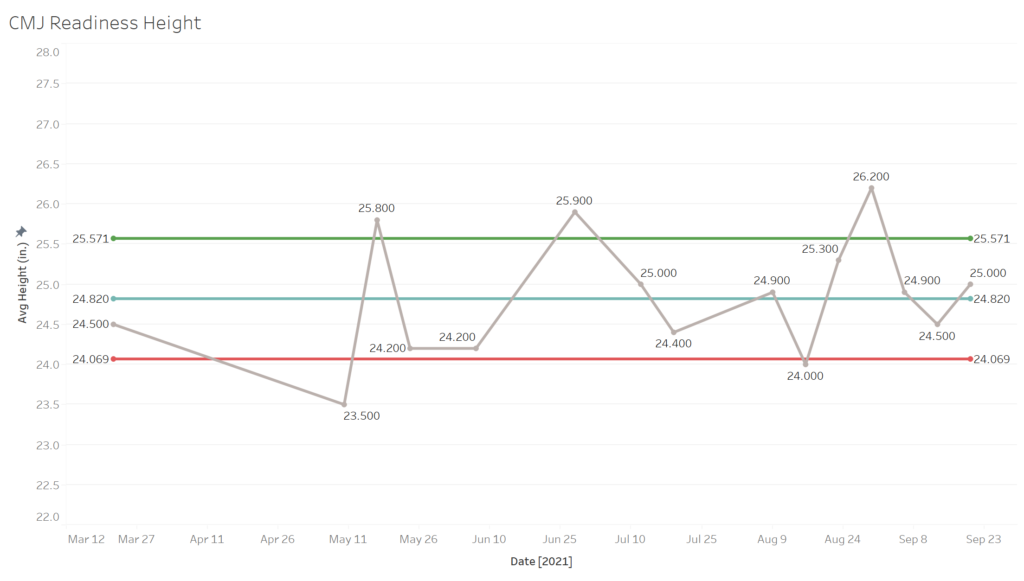
With the exception of May 10, the player’s average CMJ height stayed between the tracks – a testament to the diligence of his sleep, recovery, and in-season lifting routines.
CMJ Average Power
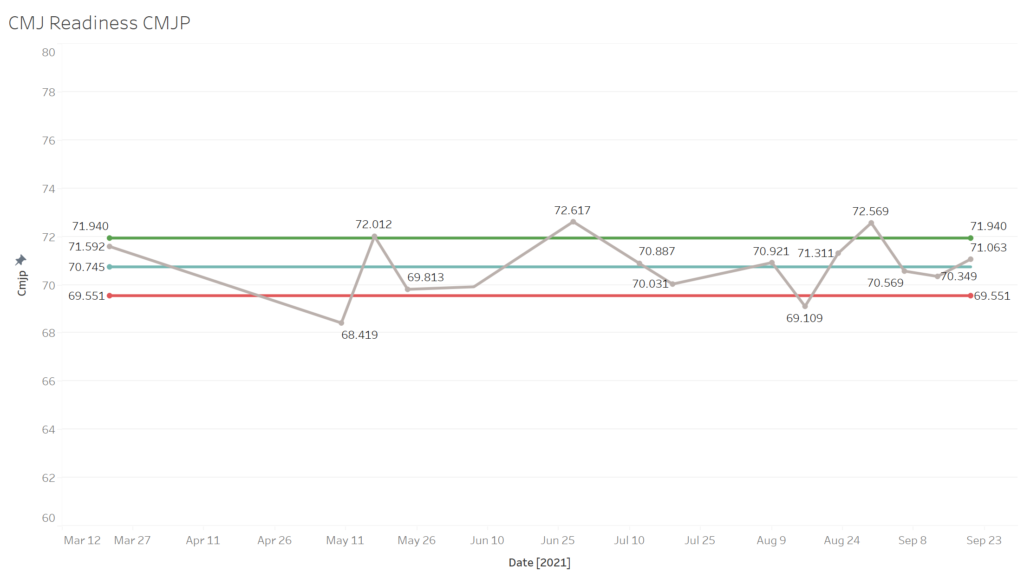
The player’s CMJ average power chart closely mirrors the average CMJ height chart – a testament to maintaining his body weight over the course of the season. For the athlete that struggles to keep weight on as the season progresses, this chart could look a lot different. His two days below the red line followed the start of the season (May 10) and a night of interrupted sleep as he saw his roommate off at 3:00am (August 16).
CMJ Average RSI
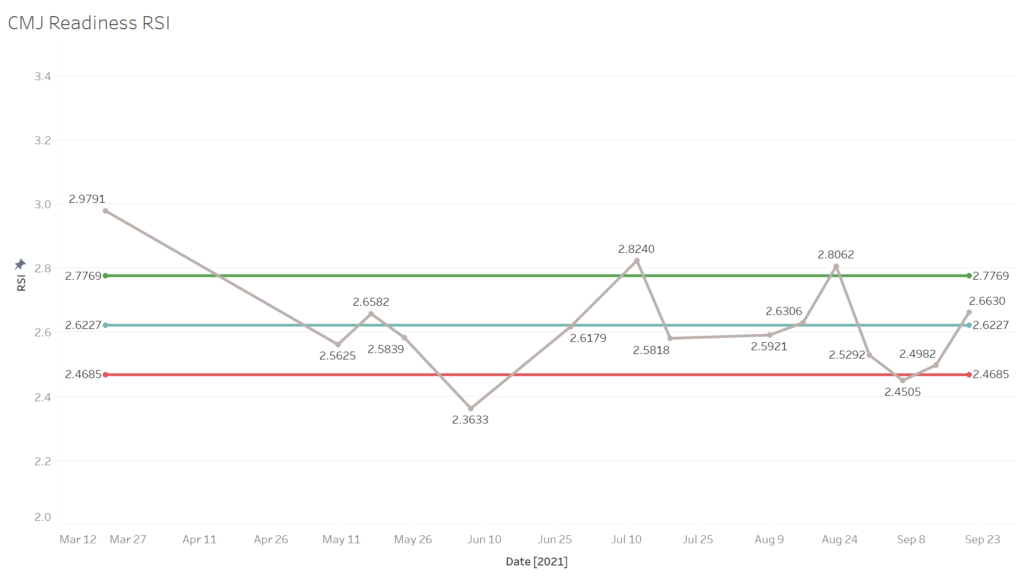
Similarly, to average CMJ height and average CMJ power, the player mostly remained between the green and red lines for the duration of the season. The two evaluations where he came in below the red line corresponded with days above the red line in height and power.
Single Leg Jumps
Lower-half symmetry is a key component to athlete health. Using a single leg jump assessment, we were able to track the player’s lower-half symmetry over the course of the MiLB season. The player is a switch-hitter, so assuming a perfect world, he would have had equal at-bats lefty and righty … unfortunately, a perfect world does not exist in MiLB. In 413 plate appearances, the player faced a RHP 86% (357 out of 413) of the time – meaning, he was primarily a left-handed hitter this season.
Baseball is a game of asymmetry as each leg has a different role while hitting and pitching (one leg loads and unloads force while the other leg receives it). On average, asymmetry for baseball players is around 10%. Understanding that baseball players operate with a degree of asymmetry, the primary goal in monitoring lower-half symmetry was to make sure it didn’t go too far beyond what is normal. If lower-half asymmetry gets too far out of whack, the athlete becomes more susceptible to lower-half injuries (think hamstring, quad, calf pulls and strains) – which makes sense because the greater the asymmetry, the more load one leg is carrying vs. the other.
Similar to the CMJ 3 assessment, the three primary metrics that were tracked for the single leg jumps were average height, average power (Loden Power Points), and average RSI.
Observed Trends
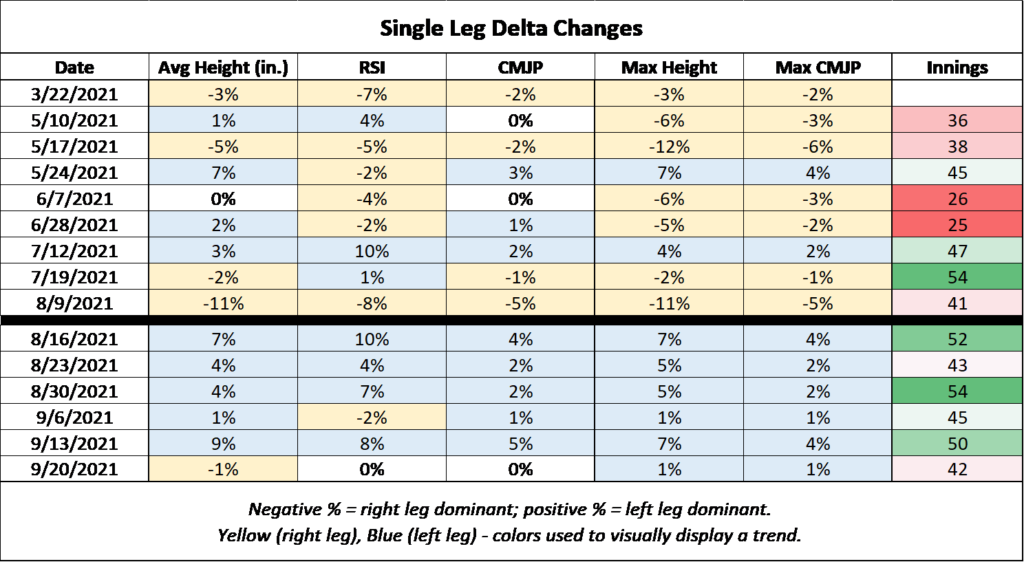
The above chart tracks the player’s percent difference between right and left leg outputs over the course of the season. The five metrics tracked (left-to-right) are average height, average RSI, average power (Loden Power Points), maximum height, and maximum power. A few observations:
- The player’s pre-spring training evaluation showed slight right leg dominance, but he was almost perfectly symmetrical.
- 86% of the player’s at-bats came left-handed over the course of the season.
- The player averaged 39 innings per week before the black line in the table above and 48 innings per week after the black line.
- As the calendar flipped to August, the more innings he played the previous week, the seemingly more left-leg dominant he showed in the evaluation.
- As the season progressed, the player went from showing more right-leg dominant to showing more left-leg dominant across the five tracked single leg metrics.
- The player showed almost perfectly symmetrical on the day after the last game of the season.
Conclusion
With this athlete, there appears to be a relationship between plant-leg “fatigue” and weekly inning-workload – it would be interesting to see if this is a trend in a larger sample. The player came into the season relatively symmetrical, so the plant-leg trend didn’t have an impact on lower-half health (he had wiggle room). We can infer that the player’s overall lower-half health can be attributed to his self-care routines and his symmetrical foundation before the season started.
In the games in the week prior to the first 7, in-season evaluations, the player had 8 extra base hits in 115 at-bats (6.9% of at-bats). In the games in the week prior to the last 7, in-season evaluations, the player had 10 extra base hits in 136 at-bats (7.3% of at-bats). His consistency in impacting the ball for extra base hits throughout the season is likely linked to some extent to the consistency of his weekly performance evaluation.
His consistency in his weekly performance evaluation can be attributed to his self-care routines: regular sleep, nutrition, recovery, and finding time to lift.