Overview
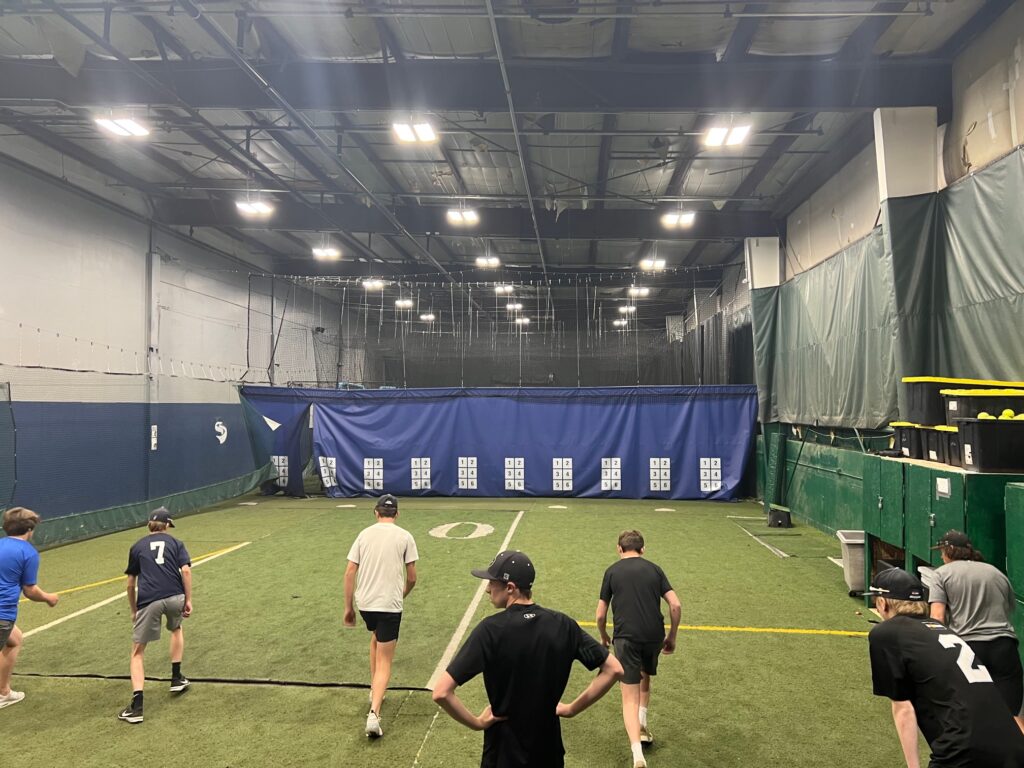
In early 2022, Loden Sports evaluated over 480 youth baseball athletes with Slammers Baseball between their locations in Englewood and Broomfield, Colorado. The youth athletes ranged in age from 8U to 14U. In addition to the Loden Sports athletic evaluations, each athlete that pitches threw off of a mound using a Rapsodo to capture pitching metrics. Following the completion of the evaluations, Slammers Baseball shared the top throwing velocities recorded by Rapsodo for each athlete for analysis. Loden Sports found a number of strong correlations between the Junior Loden Score System and throwing velocity.

In this blog, we will discuss the strong correlations between the Junior Loden Score System and throwing velocity. To further paint the picture, we’ll take a look into baseballs obsession with throwing velocity and how it relates to strikeouts and the WAR metric. We’ll discuss what is frequently overlooked: the importance of the ease at which a player throws hard and how the Junior Loden Score System factors into that. Finally, we’ll connect the dots on why regular athletic evaluation is important for player health, performance, and their development.
The link between the Junior Loden Score System and throwing velocity …
Before we dive into the analysis, 202 youth baseball athletes with Slammers Baseball participated in a standardized collection of throwing data using a Rapsodo pitching machine. Each athlete threw 10-12 pitches off a mound, fastballs only, from a mound distance determined by age regulation: 40 feet for 8U, 44 feet for 9U, 46 feet for 10U, 50 feet for 11U and 12U, and 54 feet for 13U and 14U. The top registered velocity for each athlete was used for this analysis.
The following chart illustrates the findings from running regression analysis using Junior Loden Score System metrics as the independent variable and max throwing velocity as the dependent variable. The chart is followed by metric definitions.

- The Rapsodo throwing velocity metric is a representation of the speed of the baseball as it leaves the pitcher’s hand.
- Junior Loden Score is Loden Sport’s representation of overall raw athleticism.
- Junior Loden Power Score is Loden Sport’s representation of lower-half explosivity.
- Junior Loden Speed Score is Loden Sport’s representation of top-end running speed.
A simplification: strong correlations were found between the Junior Loden Power Score, Junior Loden Score, and Junior Loden Speed Score and max throwing velocity (measured by Rapsodo).
An oversimplification: when you improve your athleticism, you improve your ability to throw hard.
Baseball 2022, an obsession with throwing hard …
Now that we have outlined the link between the Junior Loden Score System and throwing the ball hard. We would like to preface this section by saying that we understand and agree that a pitcher goes nowhere without being able to pitch.
- Locating is important.
- Effectively mixing pitches is important.
- Movement quality on pitches is important.
The above is all true. For the player who does all of the above exceptionally well and throws the ball exceptionally hard … your plaque in Cooperstown awaits.

The average fastball velocity in Major League Baseball has consistently climbed over the past 6 seasons from 92.3 mph in 2016 to 93.5 mph in 2021. The highest levels of the sport have an obsession with velocity and there’s a trickle-down effect.
We ran some analysis using publicly-available Statcast data on all starting pitchers who threw at least 2,000 pitches (~20 starts x 100 pitches) during the 2021 MLB season. The chart is followed by metric definitions.

- Strikeouts per 9 innings is pretty self-explanatory, it’s the average of how many strikeouts a pitcher tallies for every 9 innings they throw.
- WAR stands for wins above replacement and over the last decade has become the gold standard for valuing baseball players. The Baseball Reference-version of the metric was used for this analysis.
- Cy Young Award Voting Points is how many total vote points the pitcher received during Cy Young voting.
In summary, at the MLB level in 2021, there was a good correlation between average fastball velocity in starting pitchers and strikeouts per 9 innings. There was a moderate correlation between average fastball velocity and the new-age, gold standard valuation metric, WAR. And there was a light correlation between average fastball velocity and Cy Young Award Voting Points.
Ease of Action

Throwing velocity has long been a focal-point objective metric used when evaluating pitchers at all levels of baseball. Modern advances in player development have furthered the pursuit of throwing hard, but for many young pitchers, the pursuit of velocity is coupled with a max effort delivery. Similar to how swinging for the fences can come at the expense of contact, throwing hard can come at the expense of throwing strikes.
At the end of the day, professional scouts are looking for pitchers that they think can start in the big leagues and this almost unanimously includes a low-effort delivery, 3+ pitches, and plenty of strikes. The best way for a player to throw harder without sacrificing throwing strikes is to improve the ingredients of the Junior Loden Score System: sprint speed and vertical jumping ability.
An oversimplification: the higher the Junior Loden Score, the more power the pitcher has to play with. The more power the pitcher has to play with, the less effort they need in their delivery to throw hard. Take two pitchers: Pitcher A has a lower Junior Loden Score and Pitcher B has a higher Junior Loden Score…
- They may both be able to produce a 70-mph fastball in-game.
- Pitcher A may grunt and their hat falls off while they do it.
- Pitcher B probably does it much easier, has a better idea of where it’s going, and can probably sustain his velocity better.
You don’t score points for throwing hard. It is okay to acknowledge the importance of throwing velocity, but, it is also important to understand how to improve it without having to make sacrifices on the mound.
Connecting the dots ...

Understanding the relationship between the Junior Loden Score System and the baseball data confirms the importance of benchmarking athleticism using the Junior Loden Score System and regularly monitoring a young athlete’s athletic metrics.
The Junior Loden Score System can be used to benchmark and guide athletic development. If young athletes are going long stretches of time without improving, are they doing the right things in their training?
Regularly monitoring a young athlete’s athletic metrics provides feedback to help the athlete sustain performance in-season. If they are regressing, it will show up on the baseball field in the form of more effortful actions. It is important to sustain athletic metrics in-season (by implementing good routines), so that the athlete stays healthy, throwing velocities don’t drop, and the athlete competes at their peak physical performance.


